Stress Waves in Solids #
The study of stress waves in solids is crucial for understanding how materials respond to sudden forces. This knowledge is essential in fields such as civil engineering, materials science, and seismology, where predicting the behavior of structures under dynamic loads can prevent catastrophic failures and enhance safety.
Stress can be understood as the internal resistance of a body to external forces acting upon it. Under typical conditions, forces are gradually applied over time, allowing the stress and displacement fields within the body to adjust continuously. This process leads to an overall equilibrium as the load is steadily imposed.
However, when loads are suddenly applied within the volume of the body—such as during earthquakes, impacts from projectiles, or surface explosions—local stresses are generated. These stresses do not immediately propagate throughout the entire object, causing the rest of the body to remain initially unaware of these localized impacts. Instead, these localized stresses travel through the body as stress waves over a finite period of time. As they propagate, they convey the impact of the sudden displacement to other regions of the object, eventually affecting its overall structural integrity.
Understanding the propagation of stress waves is essential for designing materials and structures that can withstand dynamic loads. This involves studying the speed, attenuation, and reflection of these waves within different materials and configurations, which provides insights into mitigating damage from sudden impacts.
Body Waves #
Body waves are a type of seismic wave that travel through the interior of a material. They are crucial in the study of stress waves in solids as they provide valuable information about the internal structure and properties of the material. There are two primary types of body waves: Primary waves (P-waves) and Secondary waves (S-waves), each with distinct characteristics and behaviors.
Primary Waves (P-waves)
P-waves, also known as compressional waves, are the fastest type of seismic wave and thus the first to be detected by seismographs following an event such as an earthquake or explosion. They travel through solids, liquids, and gases by compressing and expanding the material in the direction the wave is moving. This movement is analogous to the way sound waves travel through air.
Secondary Waves (S-waves)
S-waves, or shear waves, are slower than P-waves and arrive after them. They travel only through solids and move by shearing or shaking the material perpendicular to the direction of wave propagation. This shearing action makes S-waves more destructive than P-waves, as they tend to cause more intense ground shaking.
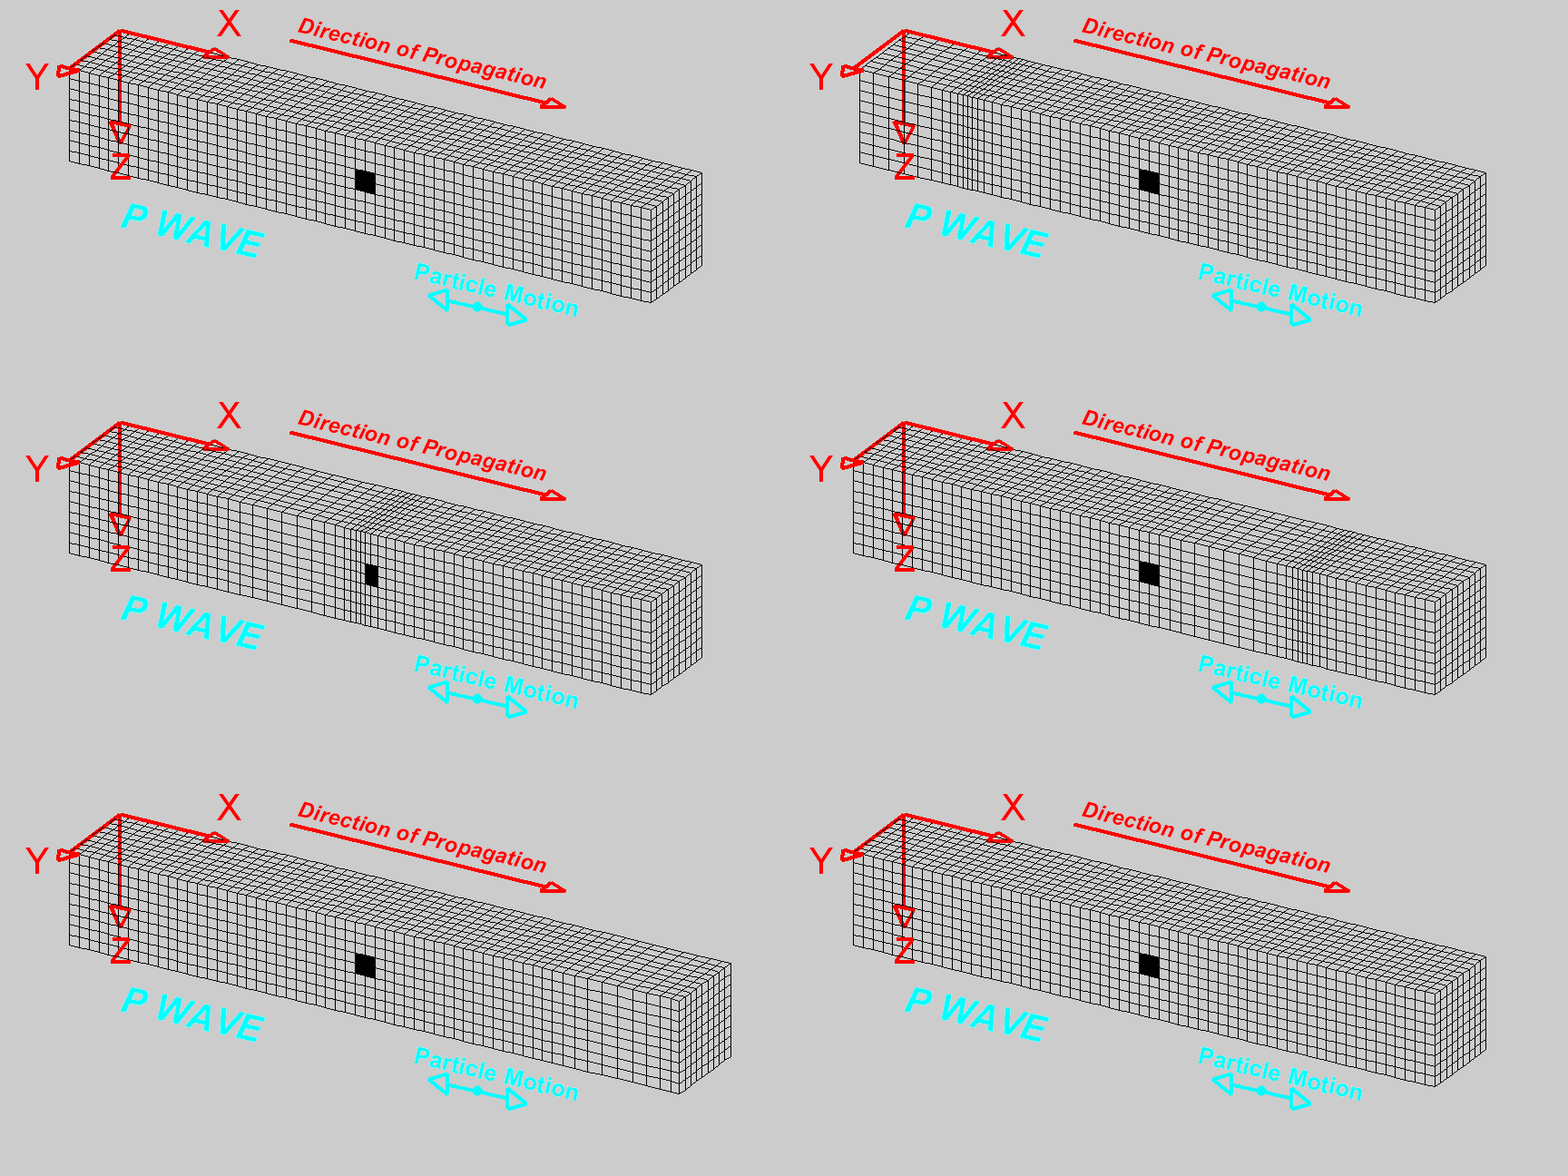
A P wave travels through a medium by means of compression and dilatation
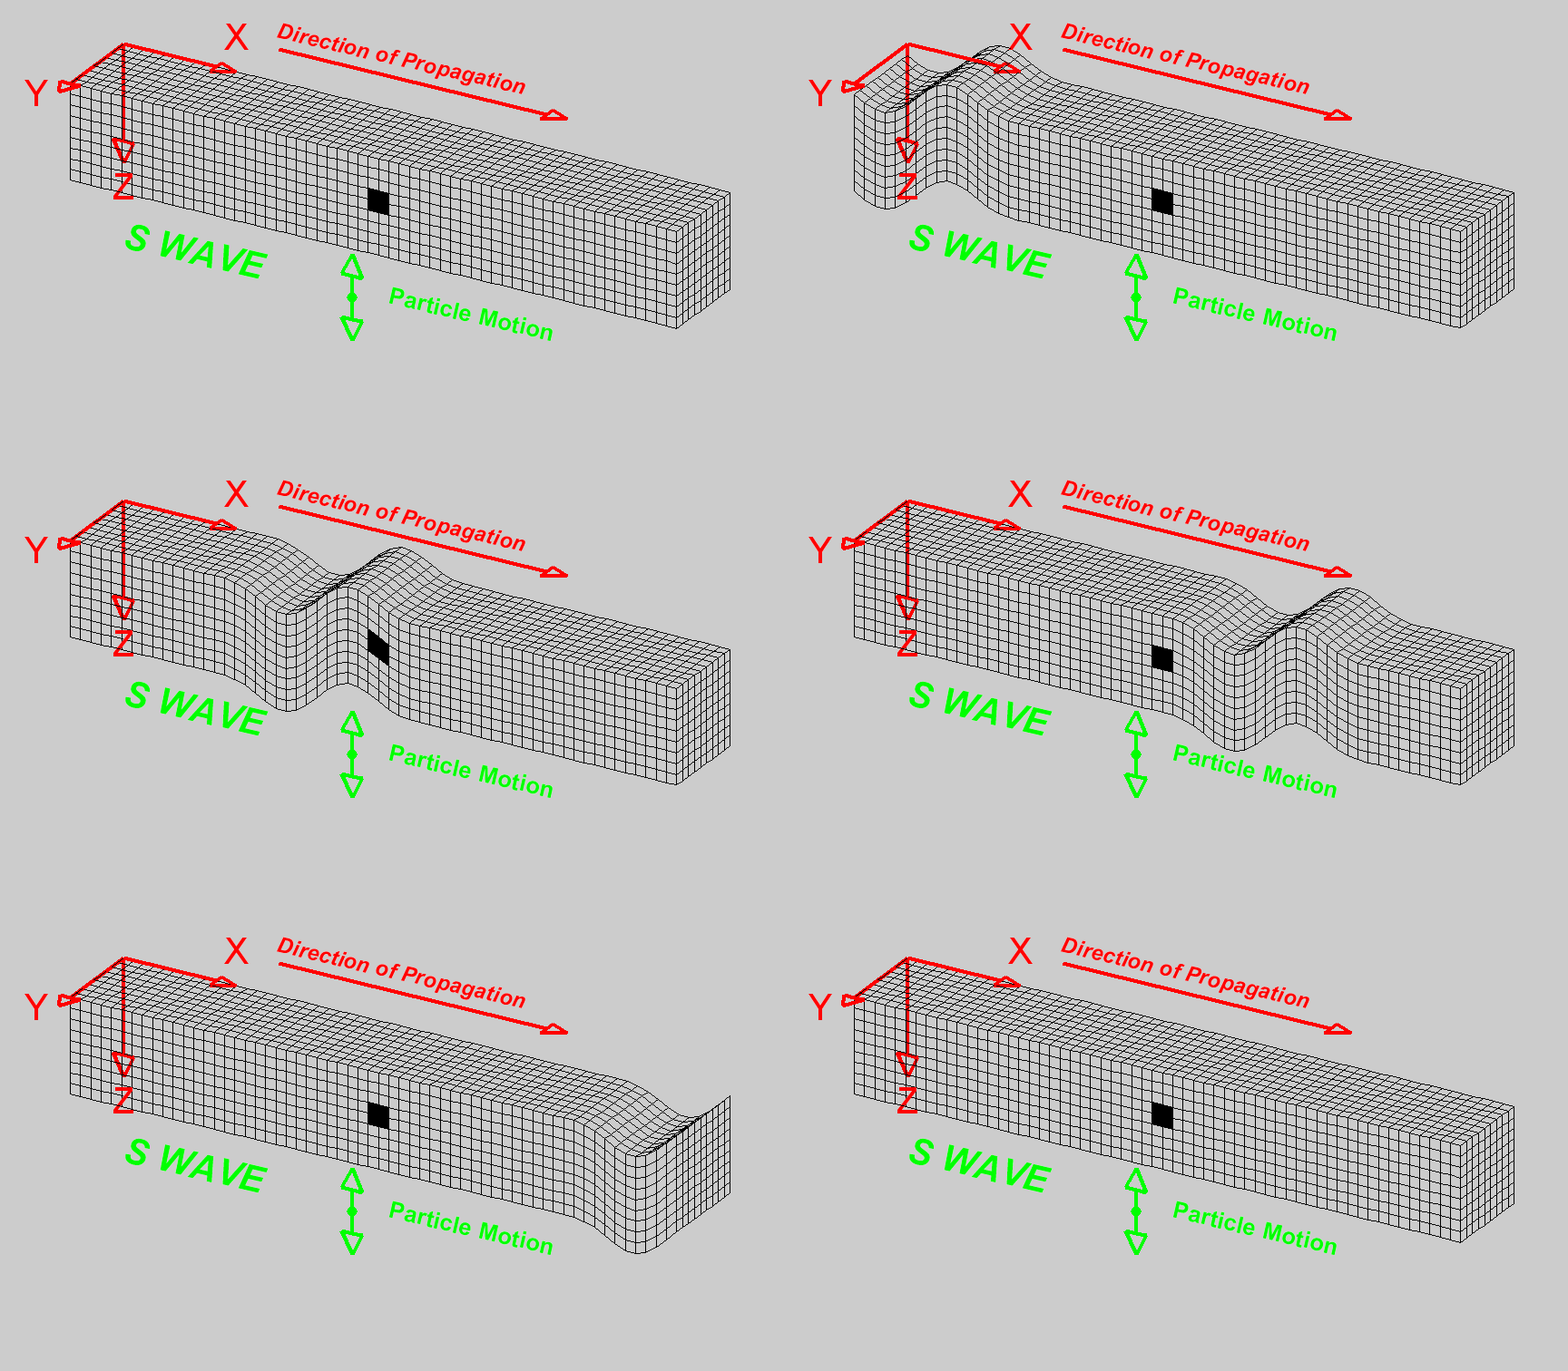
An S wave travels through a medium by shear motion
Understanding P-waves and S-waves is essential for seismologists and engineers, as analyzing their propagation through materials can reveal critical information about the material's properties and behavior under stress. This knowledge aids in designing structures that can better withstand seismic events and other dynamic loads.
Surface Waves #
Surface waves are a type of seismic wave that travel along the surface of a material rather than through its interior. These waves typically result from the interaction of body waves with the surface of the Earth or other materials and are responsible for much of the damage during earthquakes due to their large amplitude and slower decay. There are two primary types of surface waves: Rayleigh waves and Love waves, each exhibiting distinct motion patterns and characteristics.
Rayleigh Waves
Rayleigh waves, named after Lord Rayleigh who first predicted their existence, are a type of surface wave that propagate with an elliptical motion. This motion is a combination of both longitudinal and transverse movements, causing particles in the medium to move in an elliptical path as the wave passes. Rayleigh waves are responsible for the rolling motion felt during earthquakes, and their ability to cause both vertical and horizontal ground displacement makes them highly destructive, especially for buildings and structures.
Love Waves
Love waves, named after A.E.H. Love who developed the mathematical model for them, are another type of surface wave characterized by horizontal shear motion. Unlike Rayleigh waves, Love waves do not involve vertical displacement and are confined to horizontal movement. Love waves are particularly damaging to the foundations and lower structures of buildings due to their horizontal shearing effect. Their ability to cause significant lateral ground displacement poses a severe risk to infrastructure during seismic events.
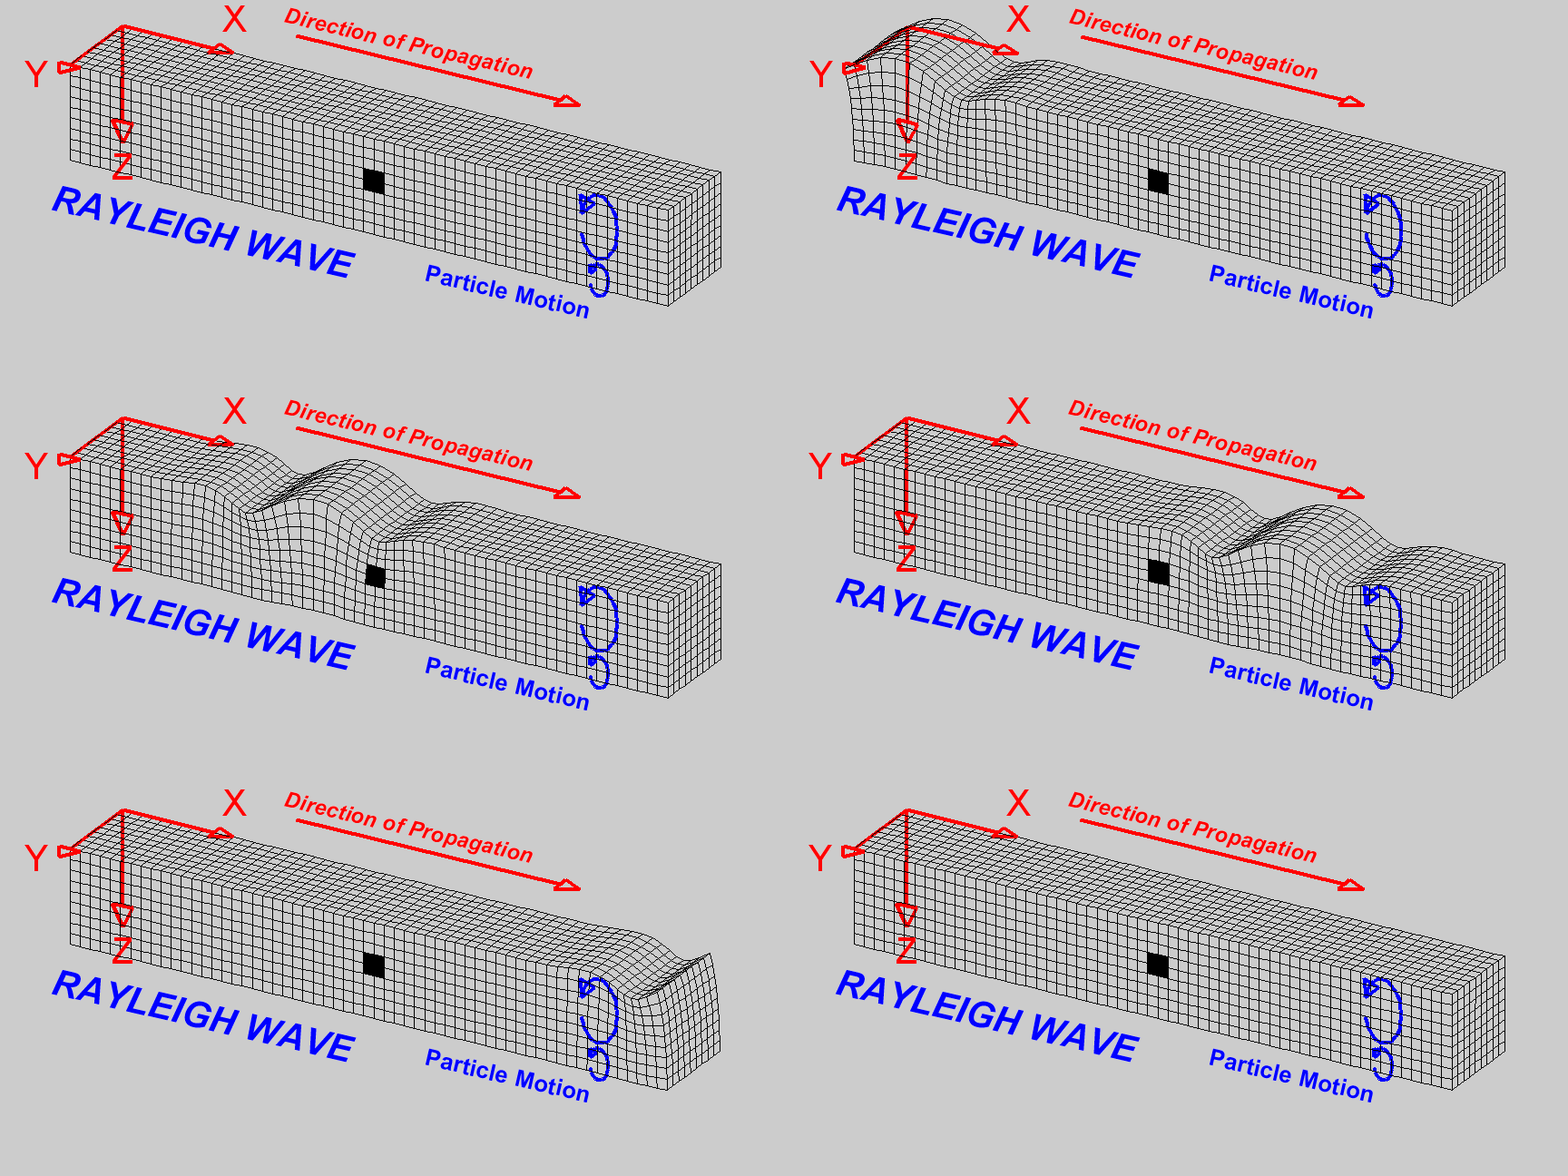
A Rayleigh wave travels through a medium.
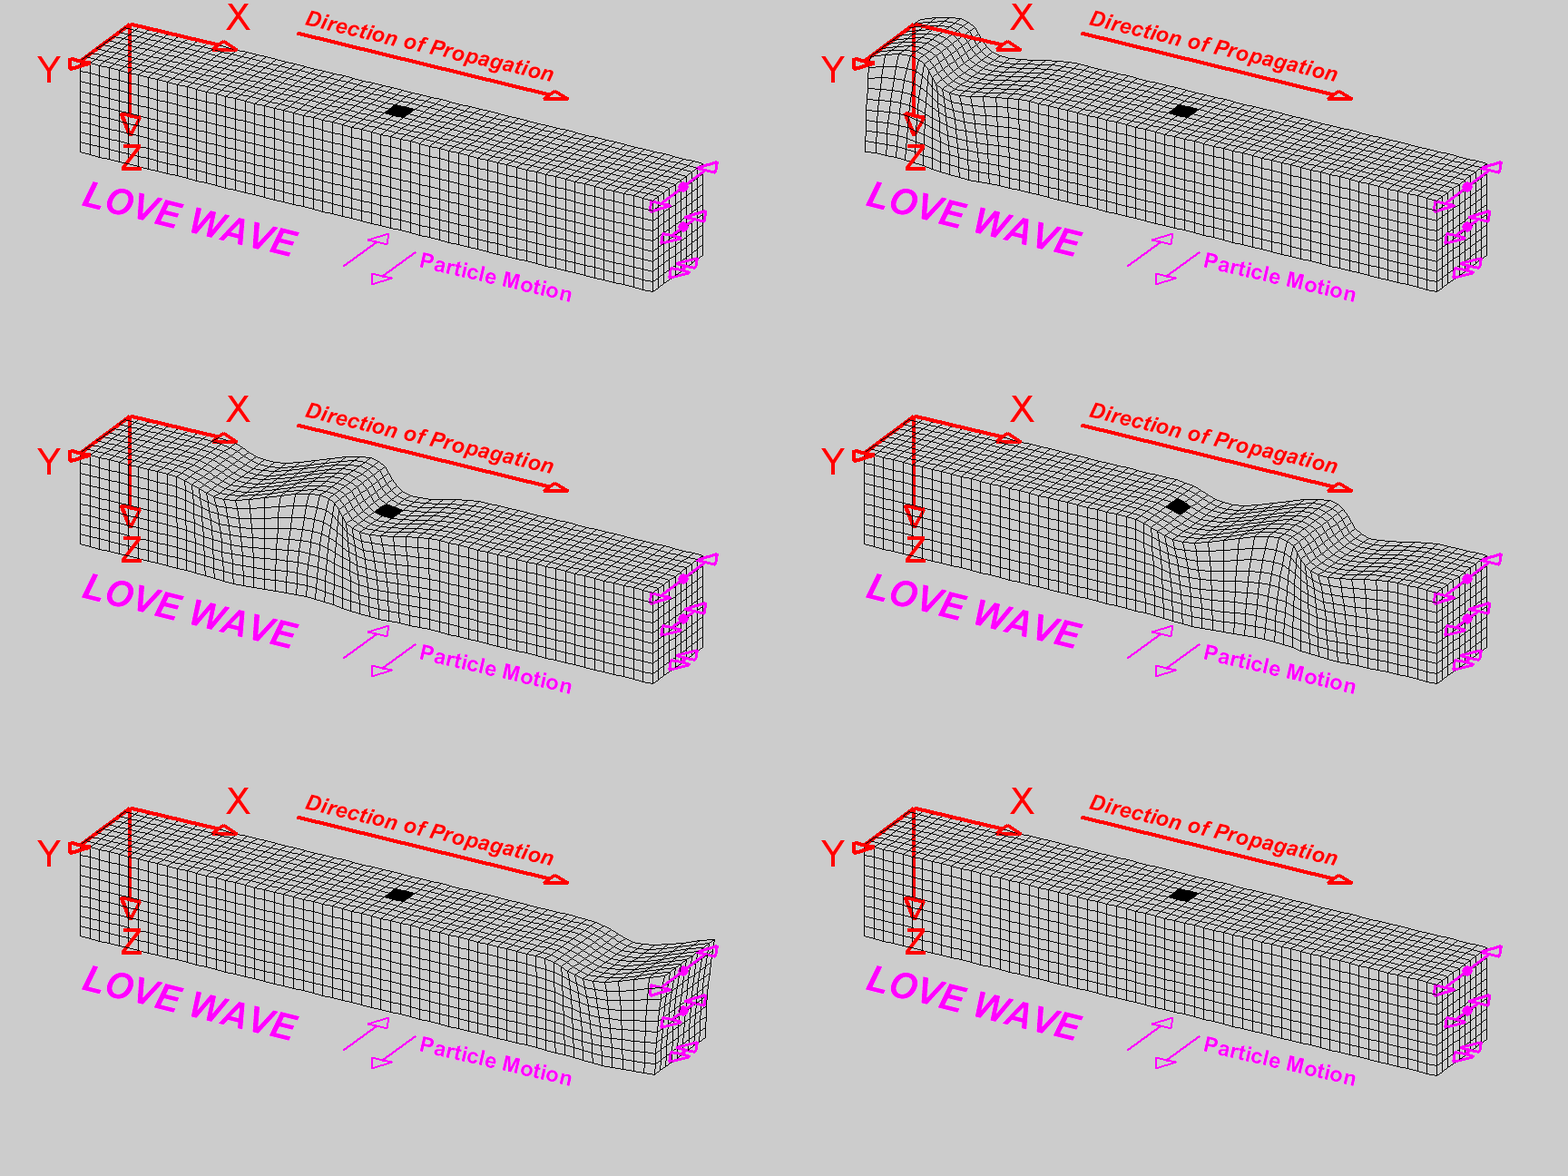
A Love wave travels through a medium.
Surface waves, including Rayleigh and Love waves, play a critical role in the propagation of seismic energy along the Earth's surface. Understanding their characteristics, such as motion patterns, speed, and amplitude, is essential for assessing the potential impact of earthquakes and designing structures to withstand their destructive effects. While body waves provide information about the internal properties of materials, surface waves are crucial for understanding and mitigating the damage to structures and the Earth's surface during seismic events.
Hertz Contact Theory #
Deformation Kinematics during Impact of a Ball on a Rod
The impact between a ball and a bar can be effectively analyzed using Hertz contact theory, which describes the contact mechanics and stress distribution between two elastic bodies. This analysis involves understanding the nonlinear differential equations that govern the stress pulse generated in the bar and the relative stiffness and compression characteristics of the materials involved.
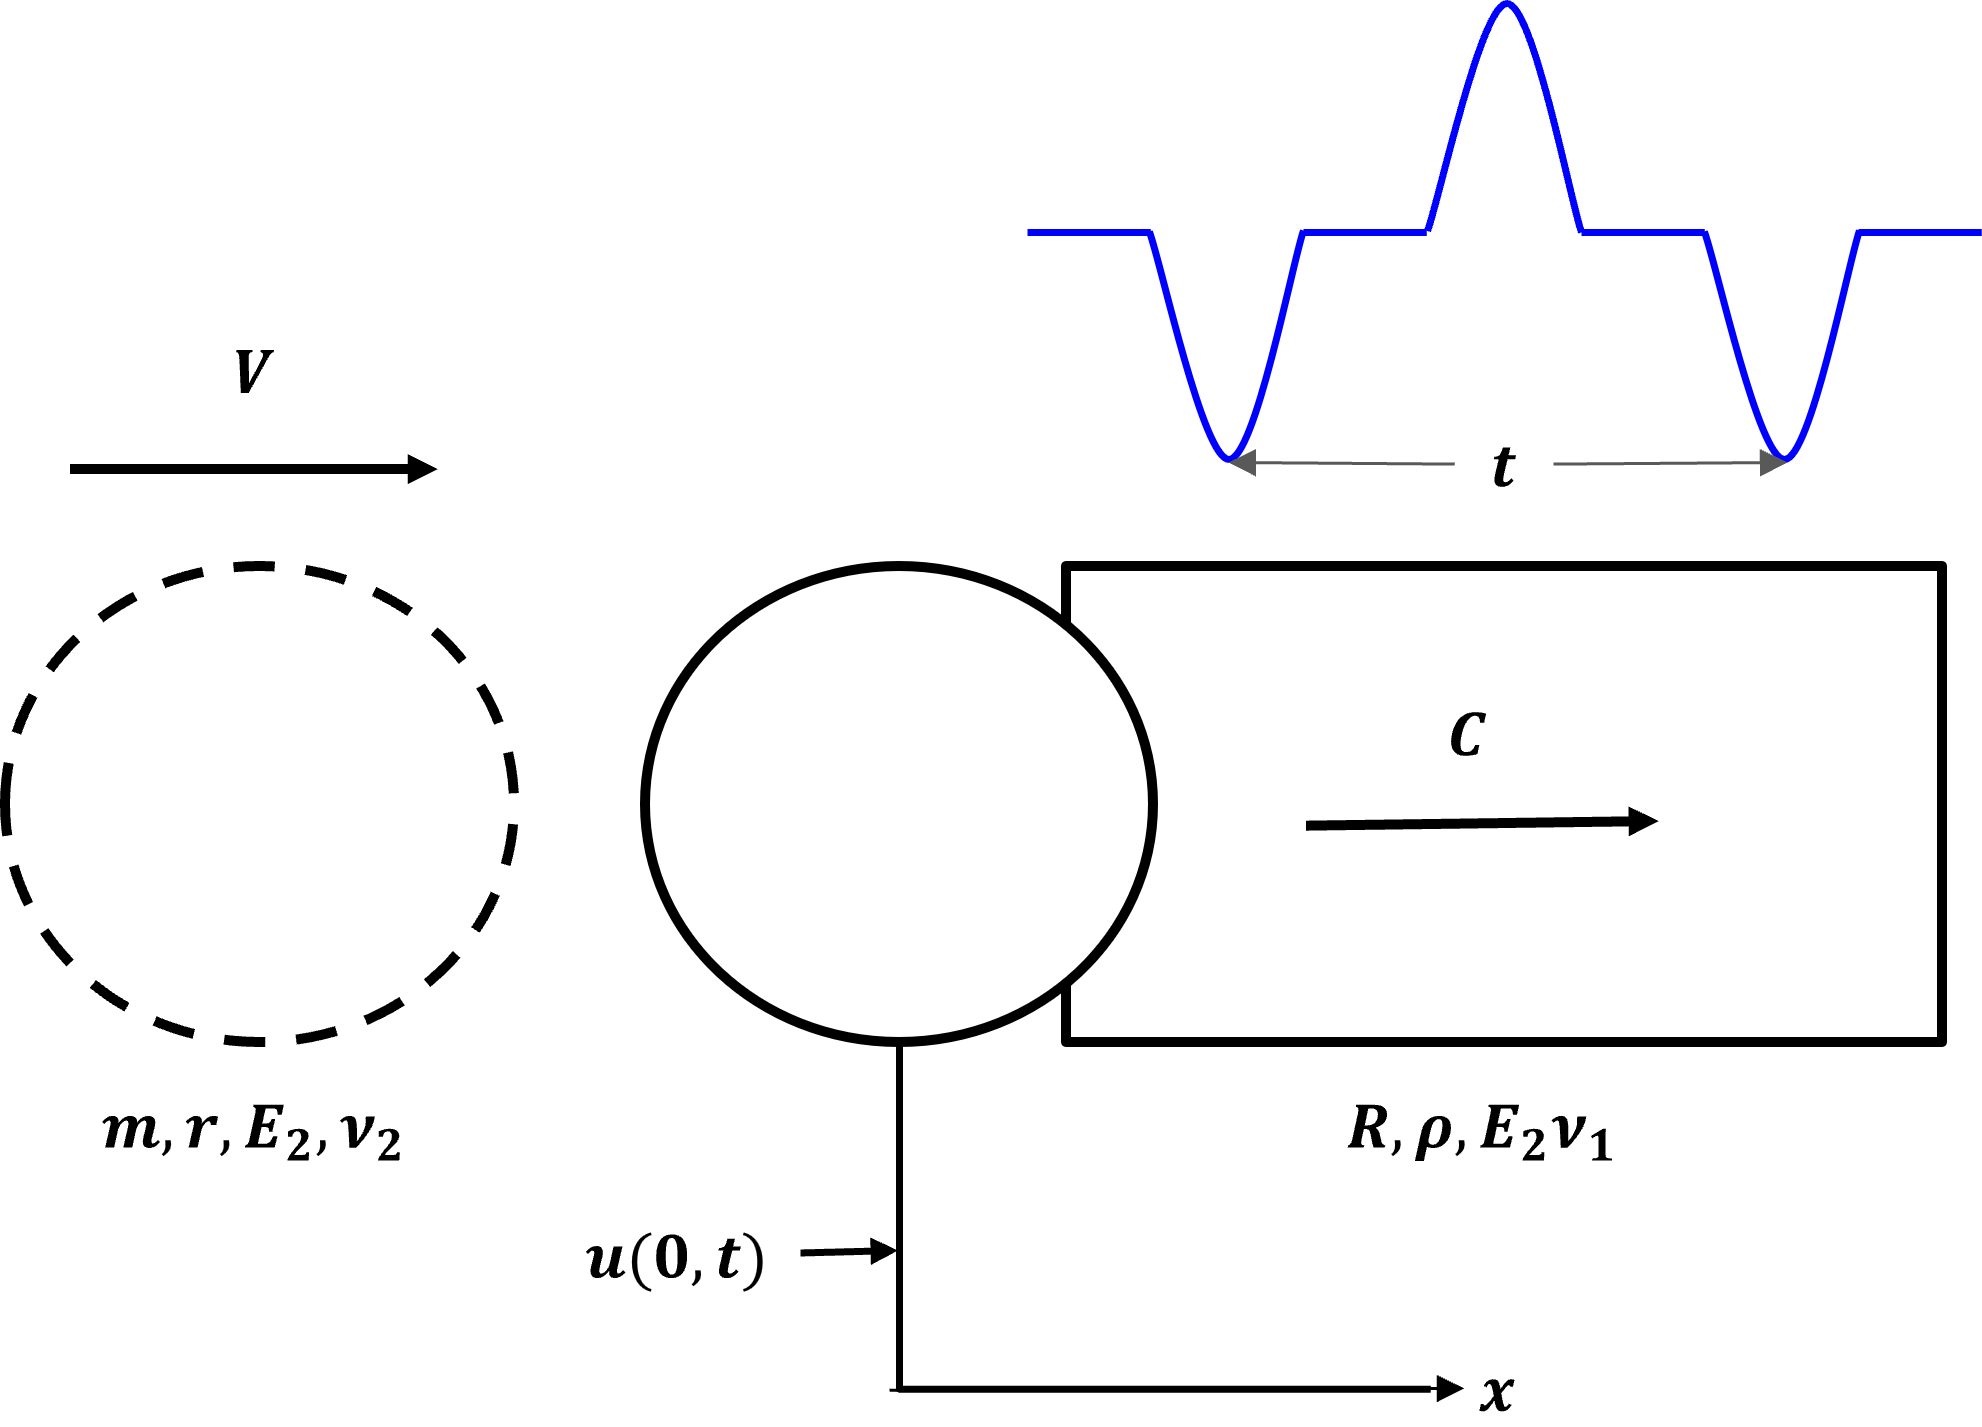
Schematic and Annotations of Ball Bar Impact
The nonlinear differential equation that governs the stress pulse created in the bar during the impact of a ball is:
\[ \frac{d^2 \alpha}{dt^2} + \frac{KC}{AE}\frac{d\alpha^{3/2}}{dt} + \frac{K}{m} \alpha^{3/2} = 0 \]
where:
- \( \alpha \) is the total relative compression of the striking ball and the struck rod.
- \( K \) is the relative stiffness.
- \( m \) is the mass of the striker (ball).
The relative stiffness \( K \) is given by:
\[ K = \frac{4}{3\pi} \frac{R^{1/2}}{k_1 + k_2} \]
where \(k_1\) and \(k_2 \) is expressed as:
\[k_1 = \frac{1-\nu^2}{\pi E_1} \] \[k_2 = \frac{1-\nu^2}{\pi E_2} \]
- \(R\) is the radius of the bar.
- \(E_1\) and \(E_2 \) are the Young’s moduli of the ball and rod, respectively.
- \(\nu_1\) and \(\nu_2 \) are the Poisson’s ratios of the ball and rod, respectively.
The force \(F\) at the ball-bar interface is given by:
\[F(t) =K[\alpha(t)]^{1/2} \]
The transient stress \(\sigma\) in the bar is given by:
\[\sigma(t) = \frac{F(t)}{A} \]
Thus the stress induced in the rod is given by:
\[\sigma(x, t) = \frac{F}{A} (Ct -x) \]
Solving for the term combined stiffness of the bar and the ball
\[K = \frac{2}{3} \frac{E\sqrt{R}}{1-\nu^2} \]
Substituting K in stress equation to obtain:
\[\sigma = - \frac{K\alpha^{3/2}}{A} \]
For solid sphere impact on a bar of varying cross-section
Consider a long bar with a step change of cross-section impacted at the larger c/s end. Let the areas of cross section of the impacted and distal parts A1 and A2 and for generality the densities and velocities of wave propagations be \(\rho_1 \) & \(\rho_2 \) and \(c_1 \) & \(c_2 \) respectively. At the step a part of the stress pulse goes through to the smaller section and a part of it gets reflected back.
By considering equilibrium of forces and continuity of displacements at the section of discontinuity:
\[\sigma_T = \sigma_I - \sigma_R\]
\[\frac{\sigma_T}{\sigma_T}\ = \frac{2 A_1 \rho_2 c_2}{A_1 \rho_1 c_1 + A_2 \rho_2 c_2} \] \[\frac{\sigma_R}{\sigma_I}\ = \frac{2 A_1 \rho_2 c_2}{A_1 \rho_1 c_1 + A_2 \rho_2 c_2} \]
If the mechanical impedances \(\rho_1 c_1\) and \(\rho_2 c_2\) are equal:
\[\frac{\sigma_T}{\sigma_T}\ = \frac{2A_1}{A_1 + A_2} \] \[\frac{\sigma_R}{\sigma_I}\ = \frac{A_2 - A_1}{A_2 + A_1} \]
Conditions and Theoretical/Ideal curves
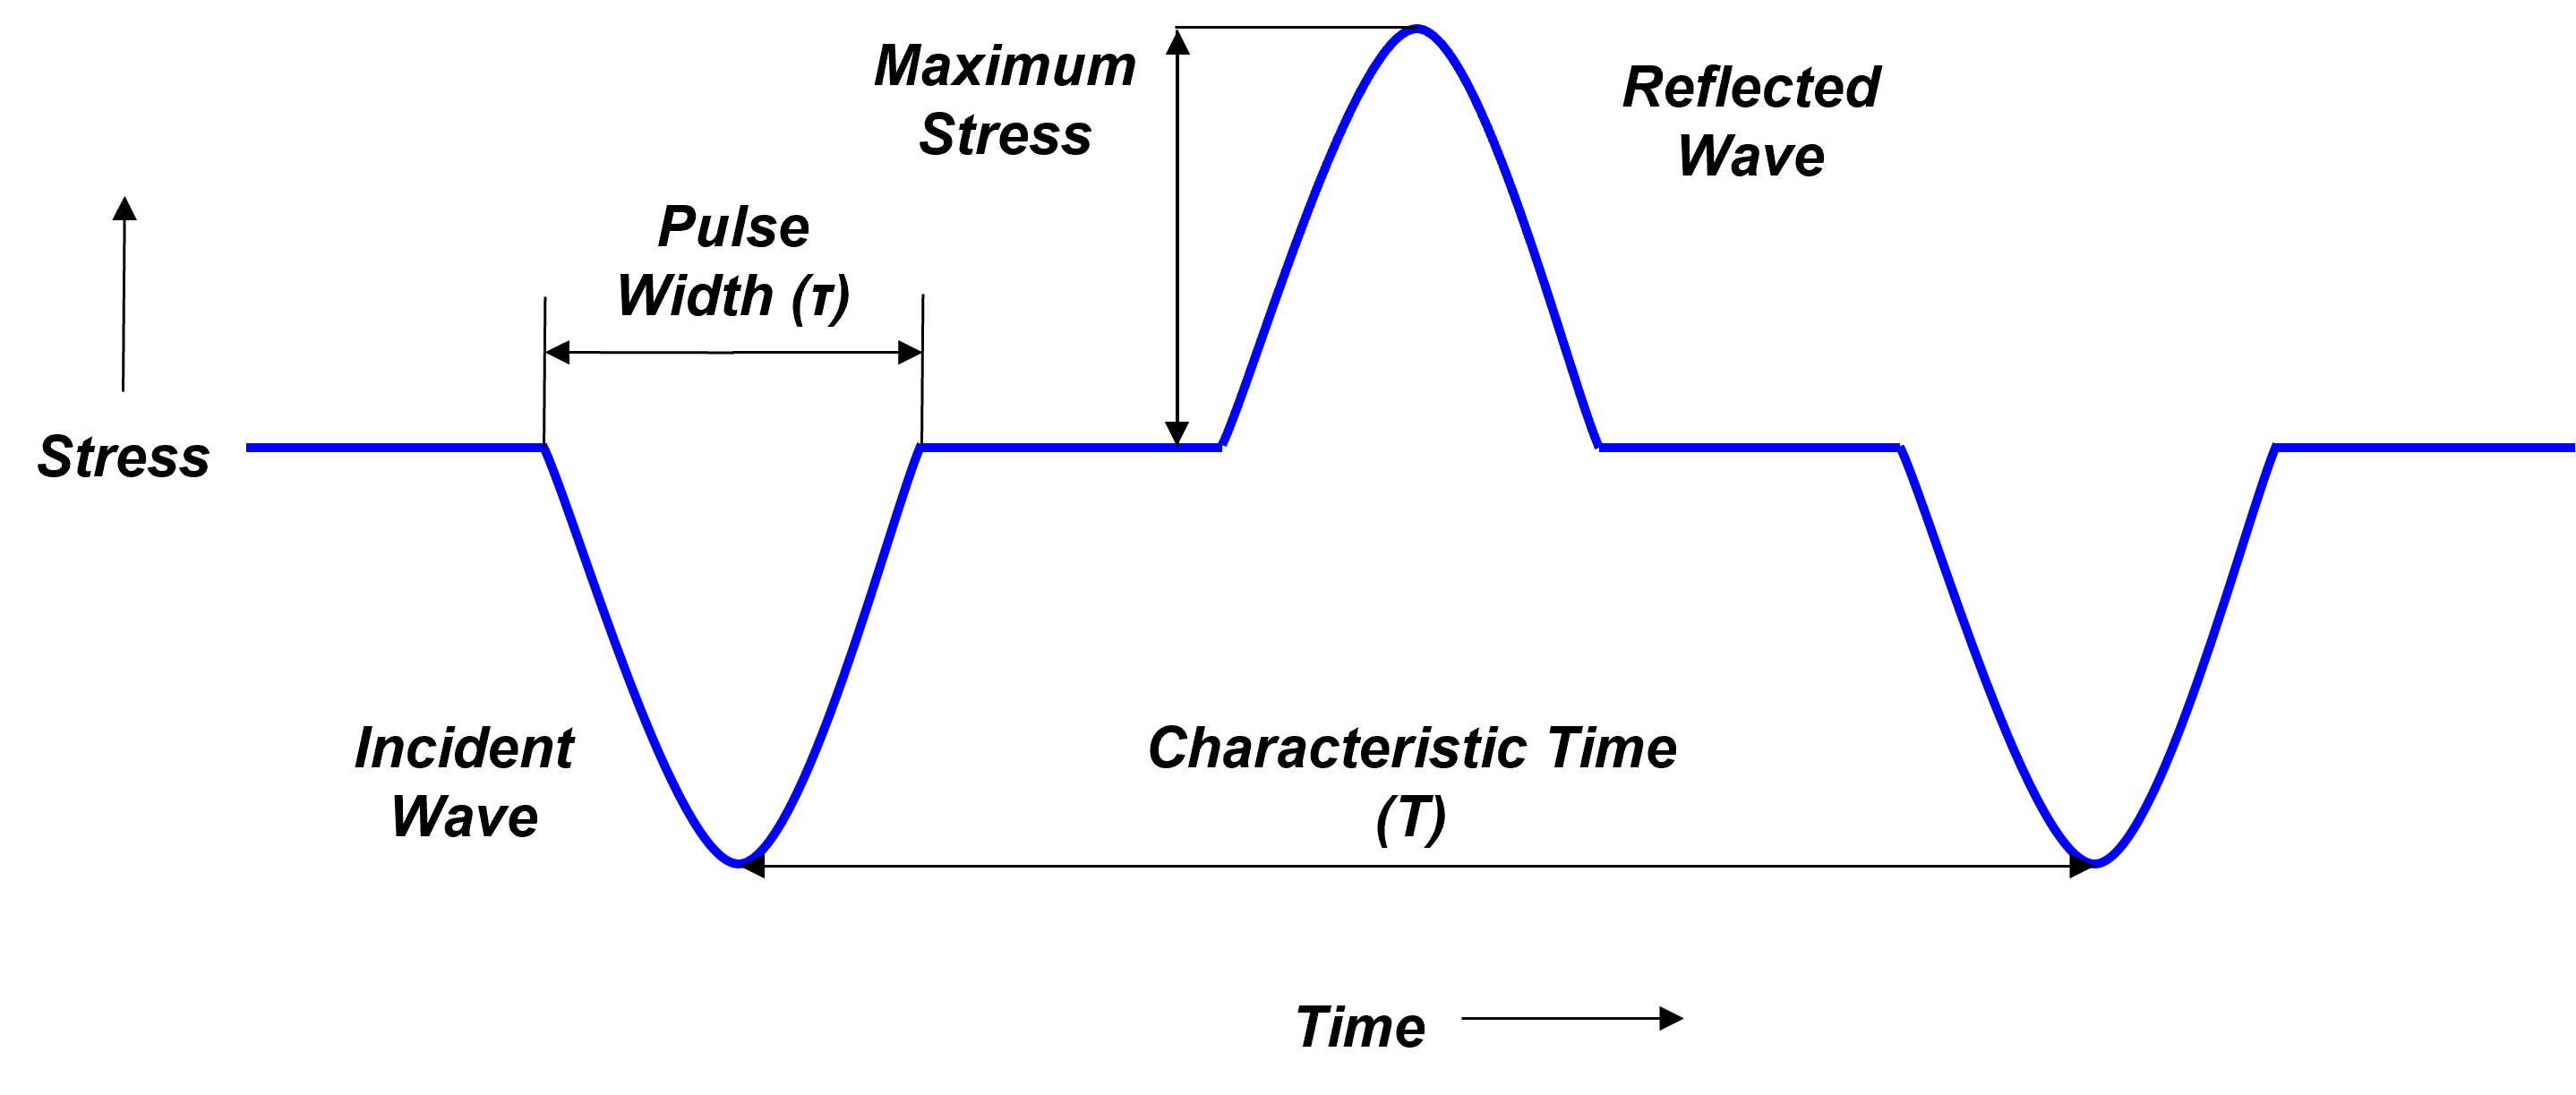
Ideal Stress-time Curve from a Ball-Bar Impact Experiment
When a bearing ball impacts a homogeneous, isotropic bar at a defined velocity, the resulting pulse travels along the bar as a compressive pulse from the impact end, which then reflects as a tensile pulse from the free, distal end. A spherical stress wave originates at the point of impact and transitions into a plane wave within a few diameters of the bar. If the bar is sufficiently long, the incident and reflected pulses do not overlap, allowing them to be observed separately. The contact time between the ball and the bar is referred to as the Pulse Width \(\tau\), and the time taken to complete one cycle is defined as the Characteristic Time \(T\).
The stress pulses created induce both axial (longitudinal) and diametrical (lateral) strain pulses, with the latter arising due to Poisson’s effect. The ratio of these two strains corresponds to Poisson’s ratio for the material of the rod. These strain pulses are illustrated schematically in the accompanying figure.
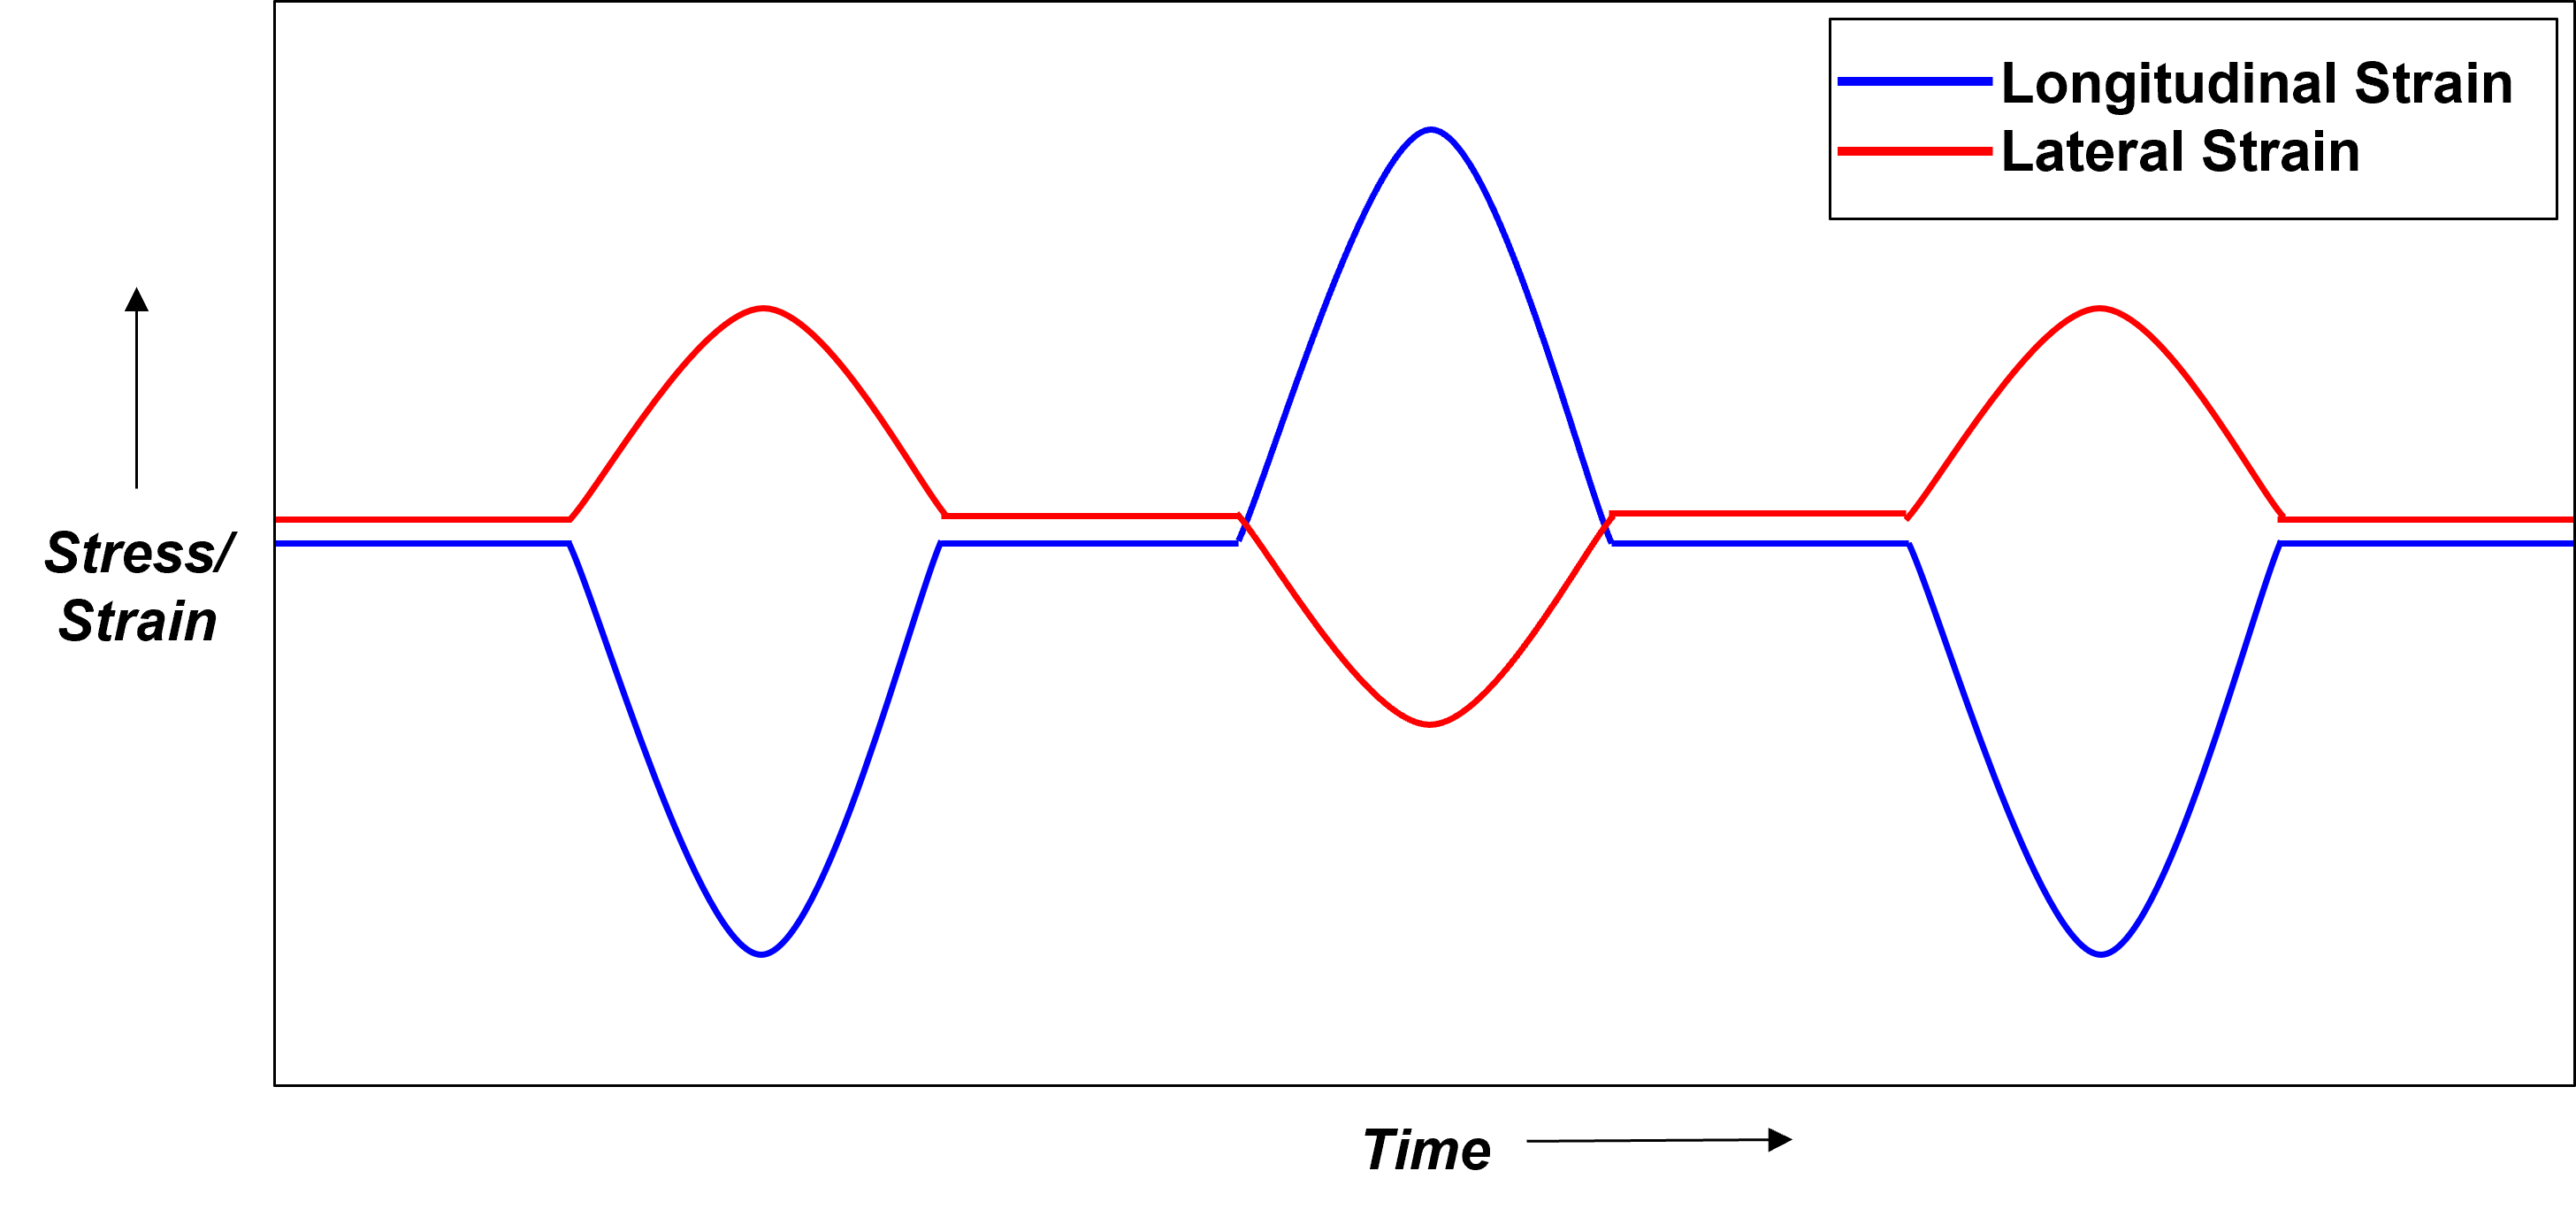
Stress/Strain - Time measurements from Longitudinal Lateral data
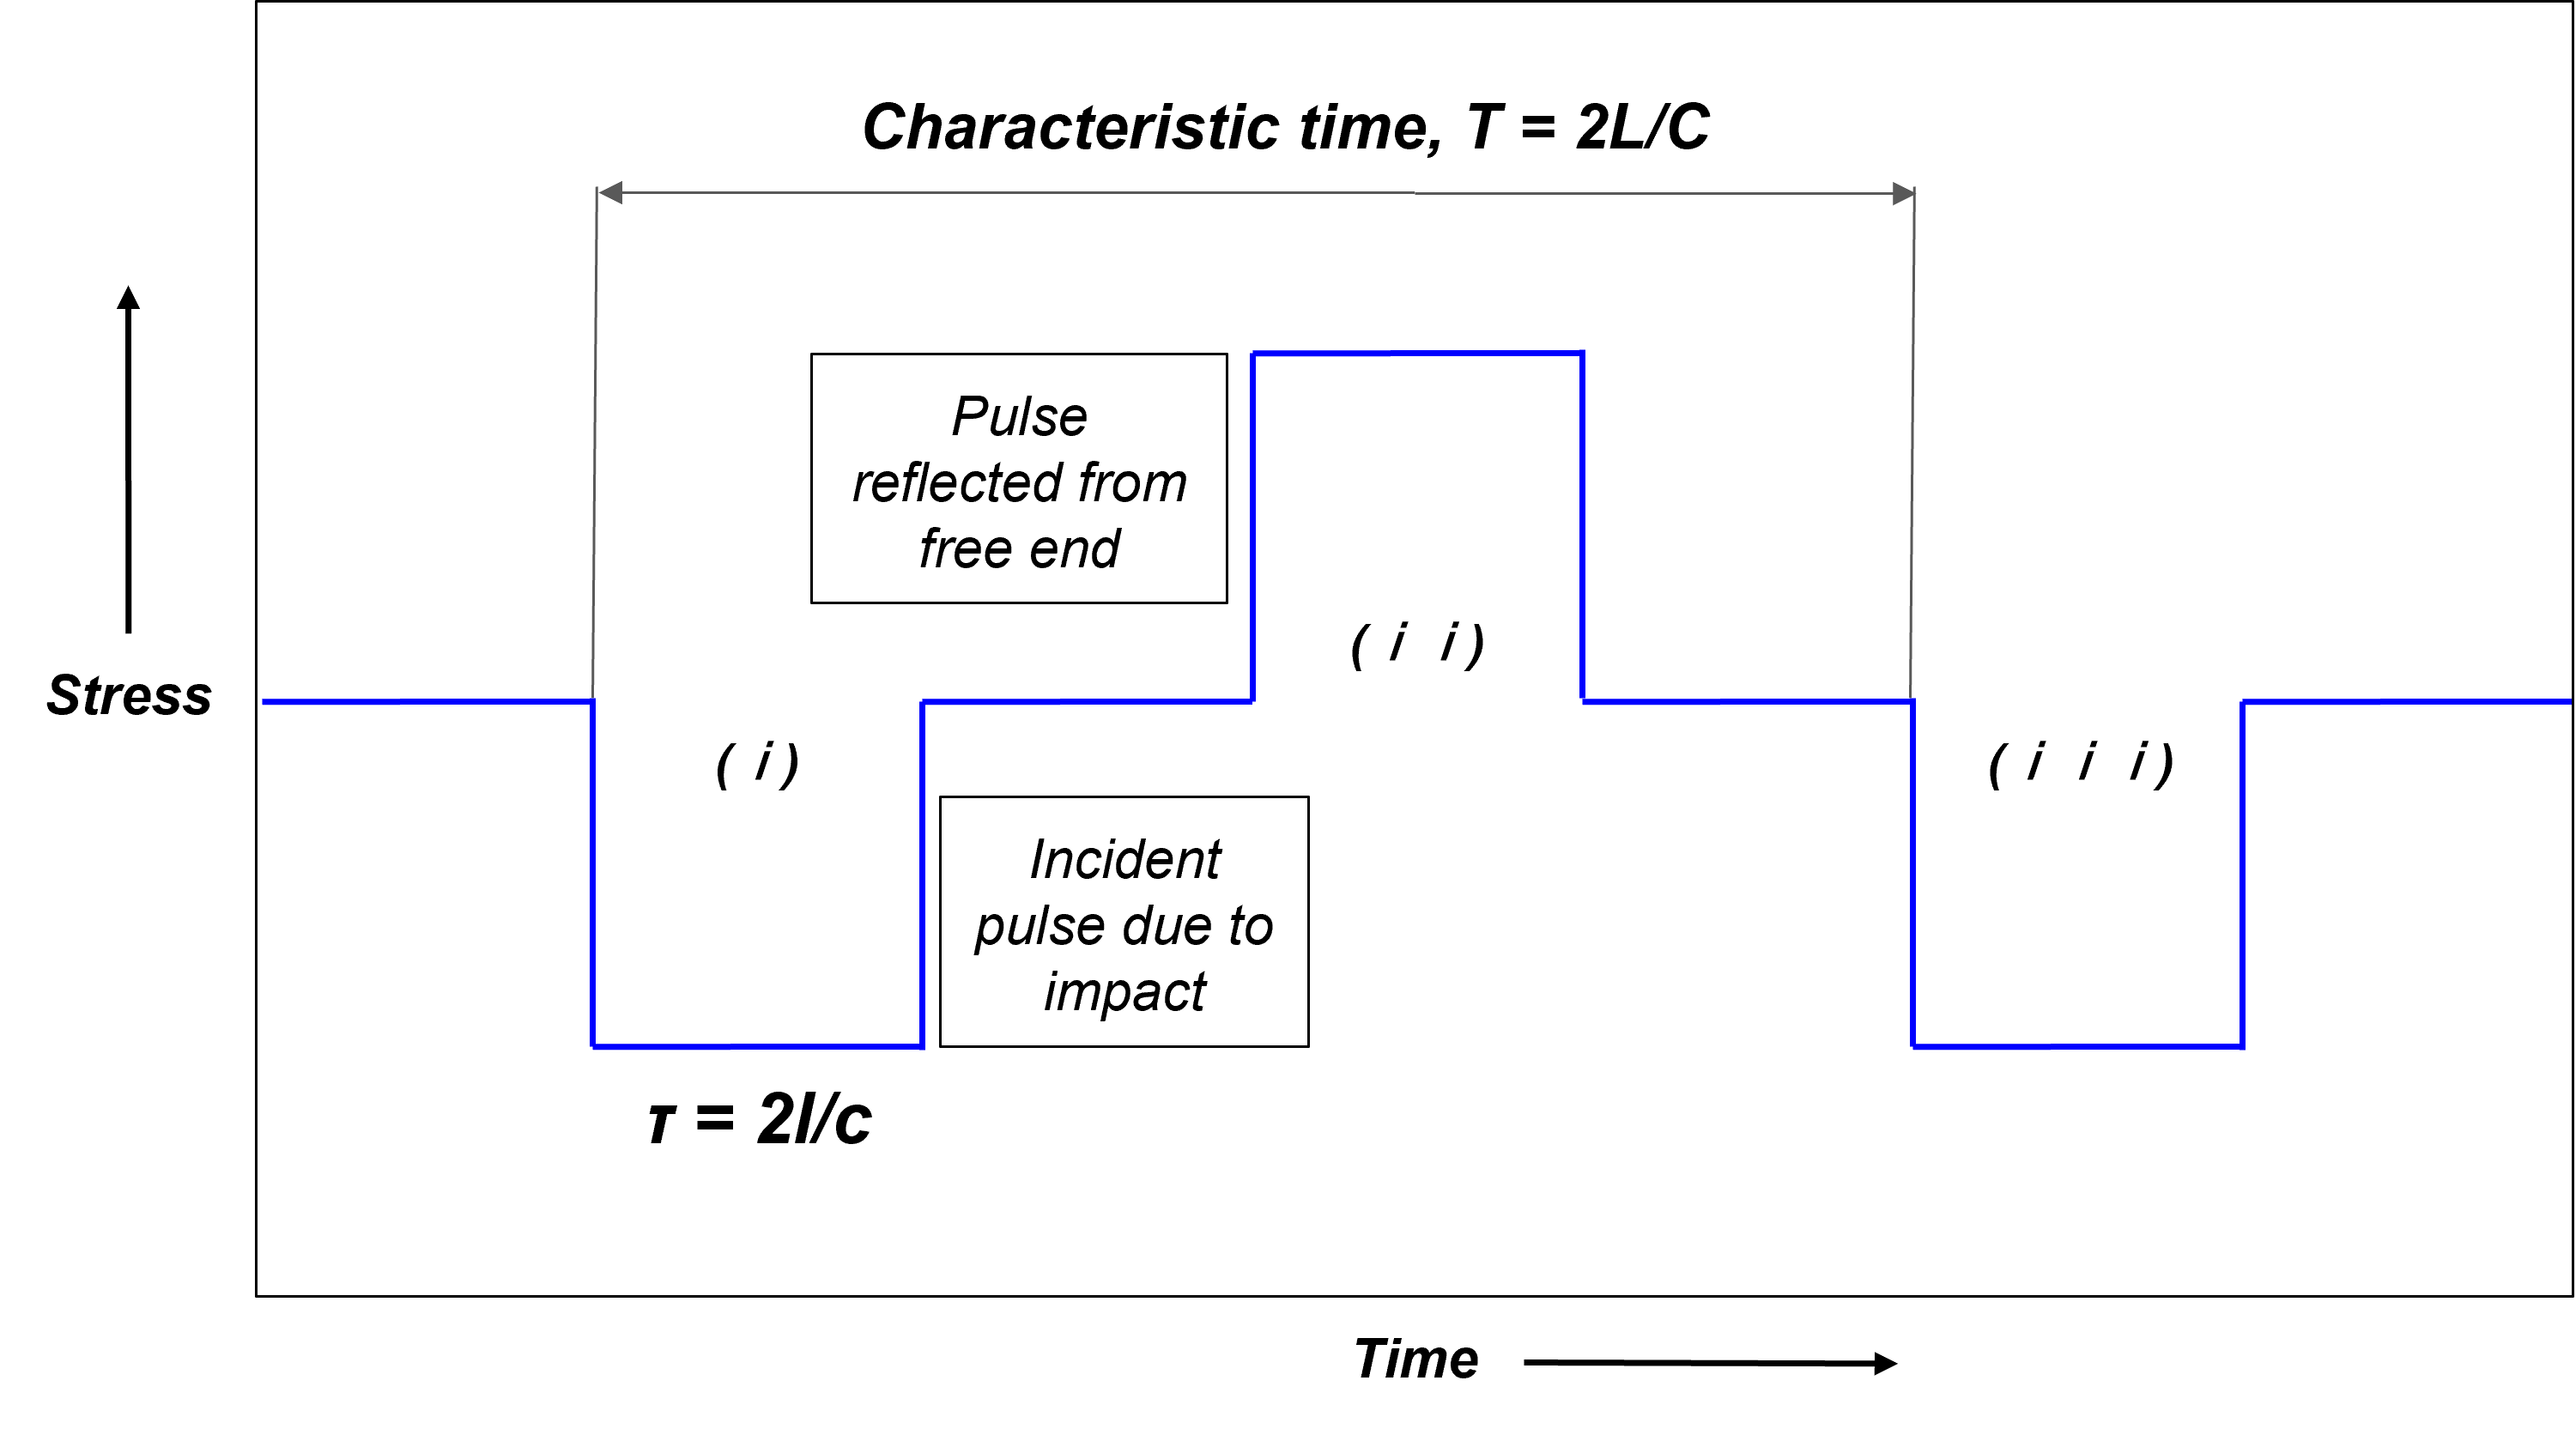
Ideal Stress-time Curve from a Bar-Bar Impact Experiment
A rectangular stress pulse of amplitude \(\sigma\) and period \(\tau\) travels along the length of the bar from the impact end to the distal end. If this end is unconstrained, a compressive stress pulse travels along the bar and reflects from the free end as a tensile pulse, which then travels back to the struck face of the bar after a time \(T = \frac{2L}{C}\). Upon reaching the new free face, as the striker bar has departed, the wave reflects once more as a compressive pulse.
In contrast, if the bar is fixed at the distal end, the reflected pulse is compressive due to the displacement constraint. This reflected pulse travels back to the impact face and re-reflects from this now free end. These notional stress pulse propagations, reflections, and re-reflections occur in finite bars until the pulses are dampened by material hysteresis. The pulses are represented as (i) through (vi), with odd-numbered pulses originating from the impact face and even-numbered pulses originating from the distal face.
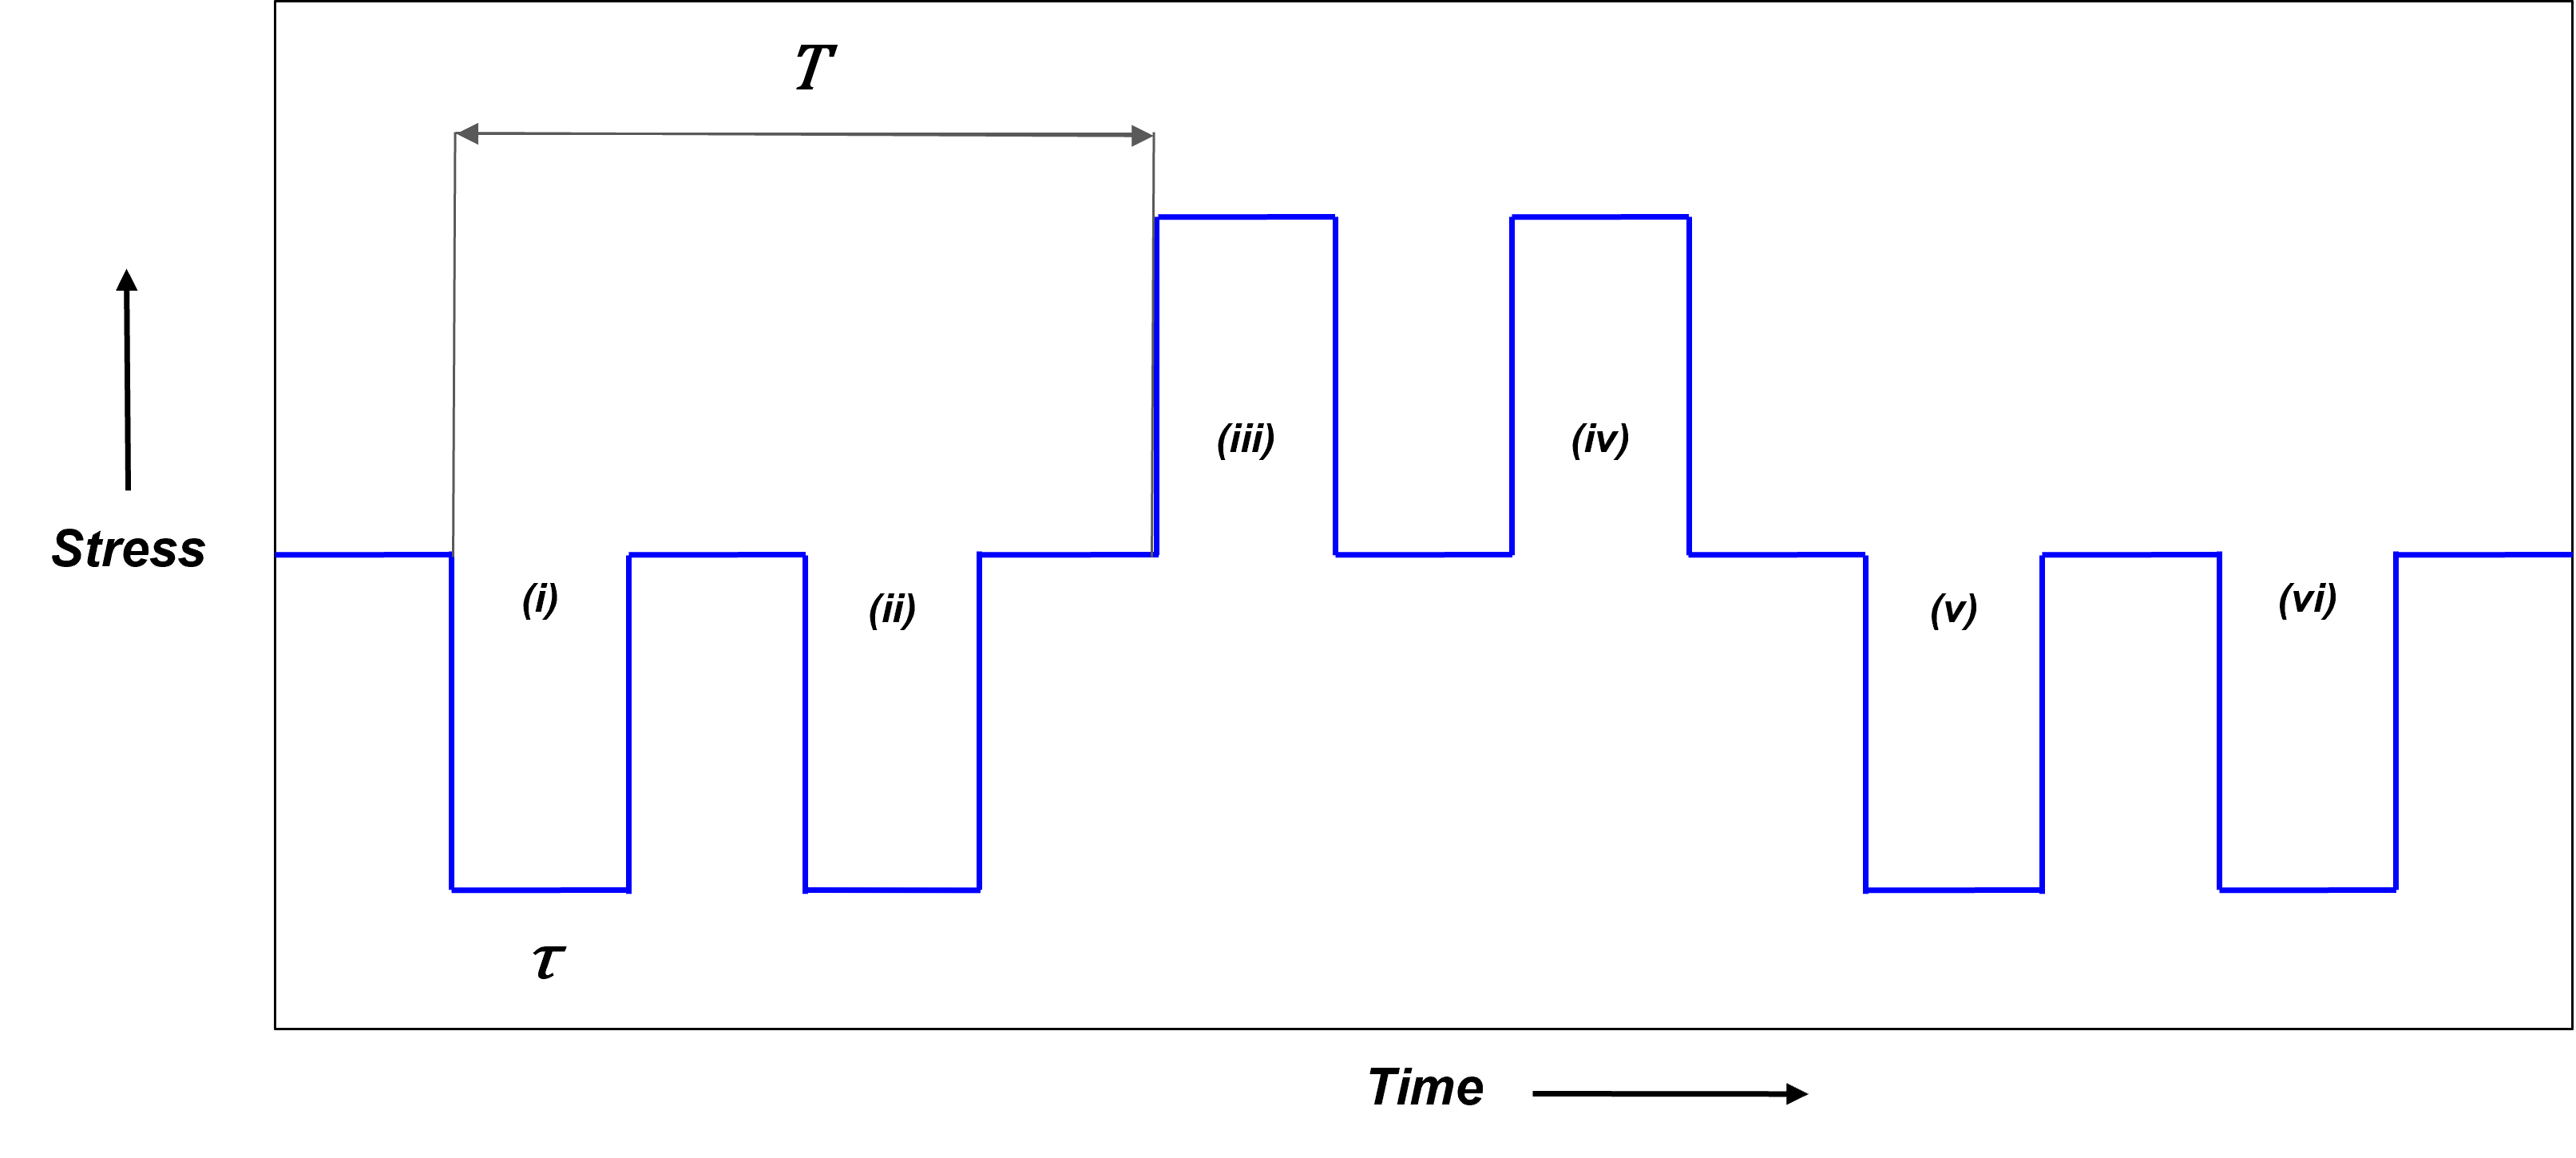
Stress-time Curve from a Bar-Bar Impact with bar end fixed
Theoretical Analysis #
This calculator determines the displacement and stress experienced during the impact of a ball on a bar, based on Hertz Contact Theory. By inputting specific physical parameters, the tool computes and plots the displacement-time and stress-time graphs.
Displacement and Stress Calculator for Ball-bar Impact
Experiment Setup #
A straight bar with a diameter of 20 mm and a length of 1.2 m was used for the experiment. The bar was suspended horizontally using nylon threads, which were attached to a support post at equal intervals along its length to ensure stability. A 30 mm steel ball bearing served as the impactor. The ball was suspended vertically from the top with nylon threads, ensuring it was precisely aligned with the center of the rod for accurate impact.
A steel sphere (or ball bearing) and a rod, supported at quarter points, were freely suspended coaxially using nylon threads from a pivot. A rectangular (0/90°) strain gauge rosette with a gauge length of 3 mm, gauge resistance of 350 ±1.0 Ω, temperature compensation for 23 × 10⁻⁶/°C, and gauge factor of 2.16 was mounted at the central section of the bar to sense the axial and circumferential strains. The two gauges in the rosette were connected as the active arms of two separate quarter Wheatstone bridges. A two-channel strain gauge amplifier powered the bridges, balanced them, and monitored them during the experiments. The output of the two channels from the amplifier was supplied to a digital storage oscilloscope, which stored and displayed the signals.
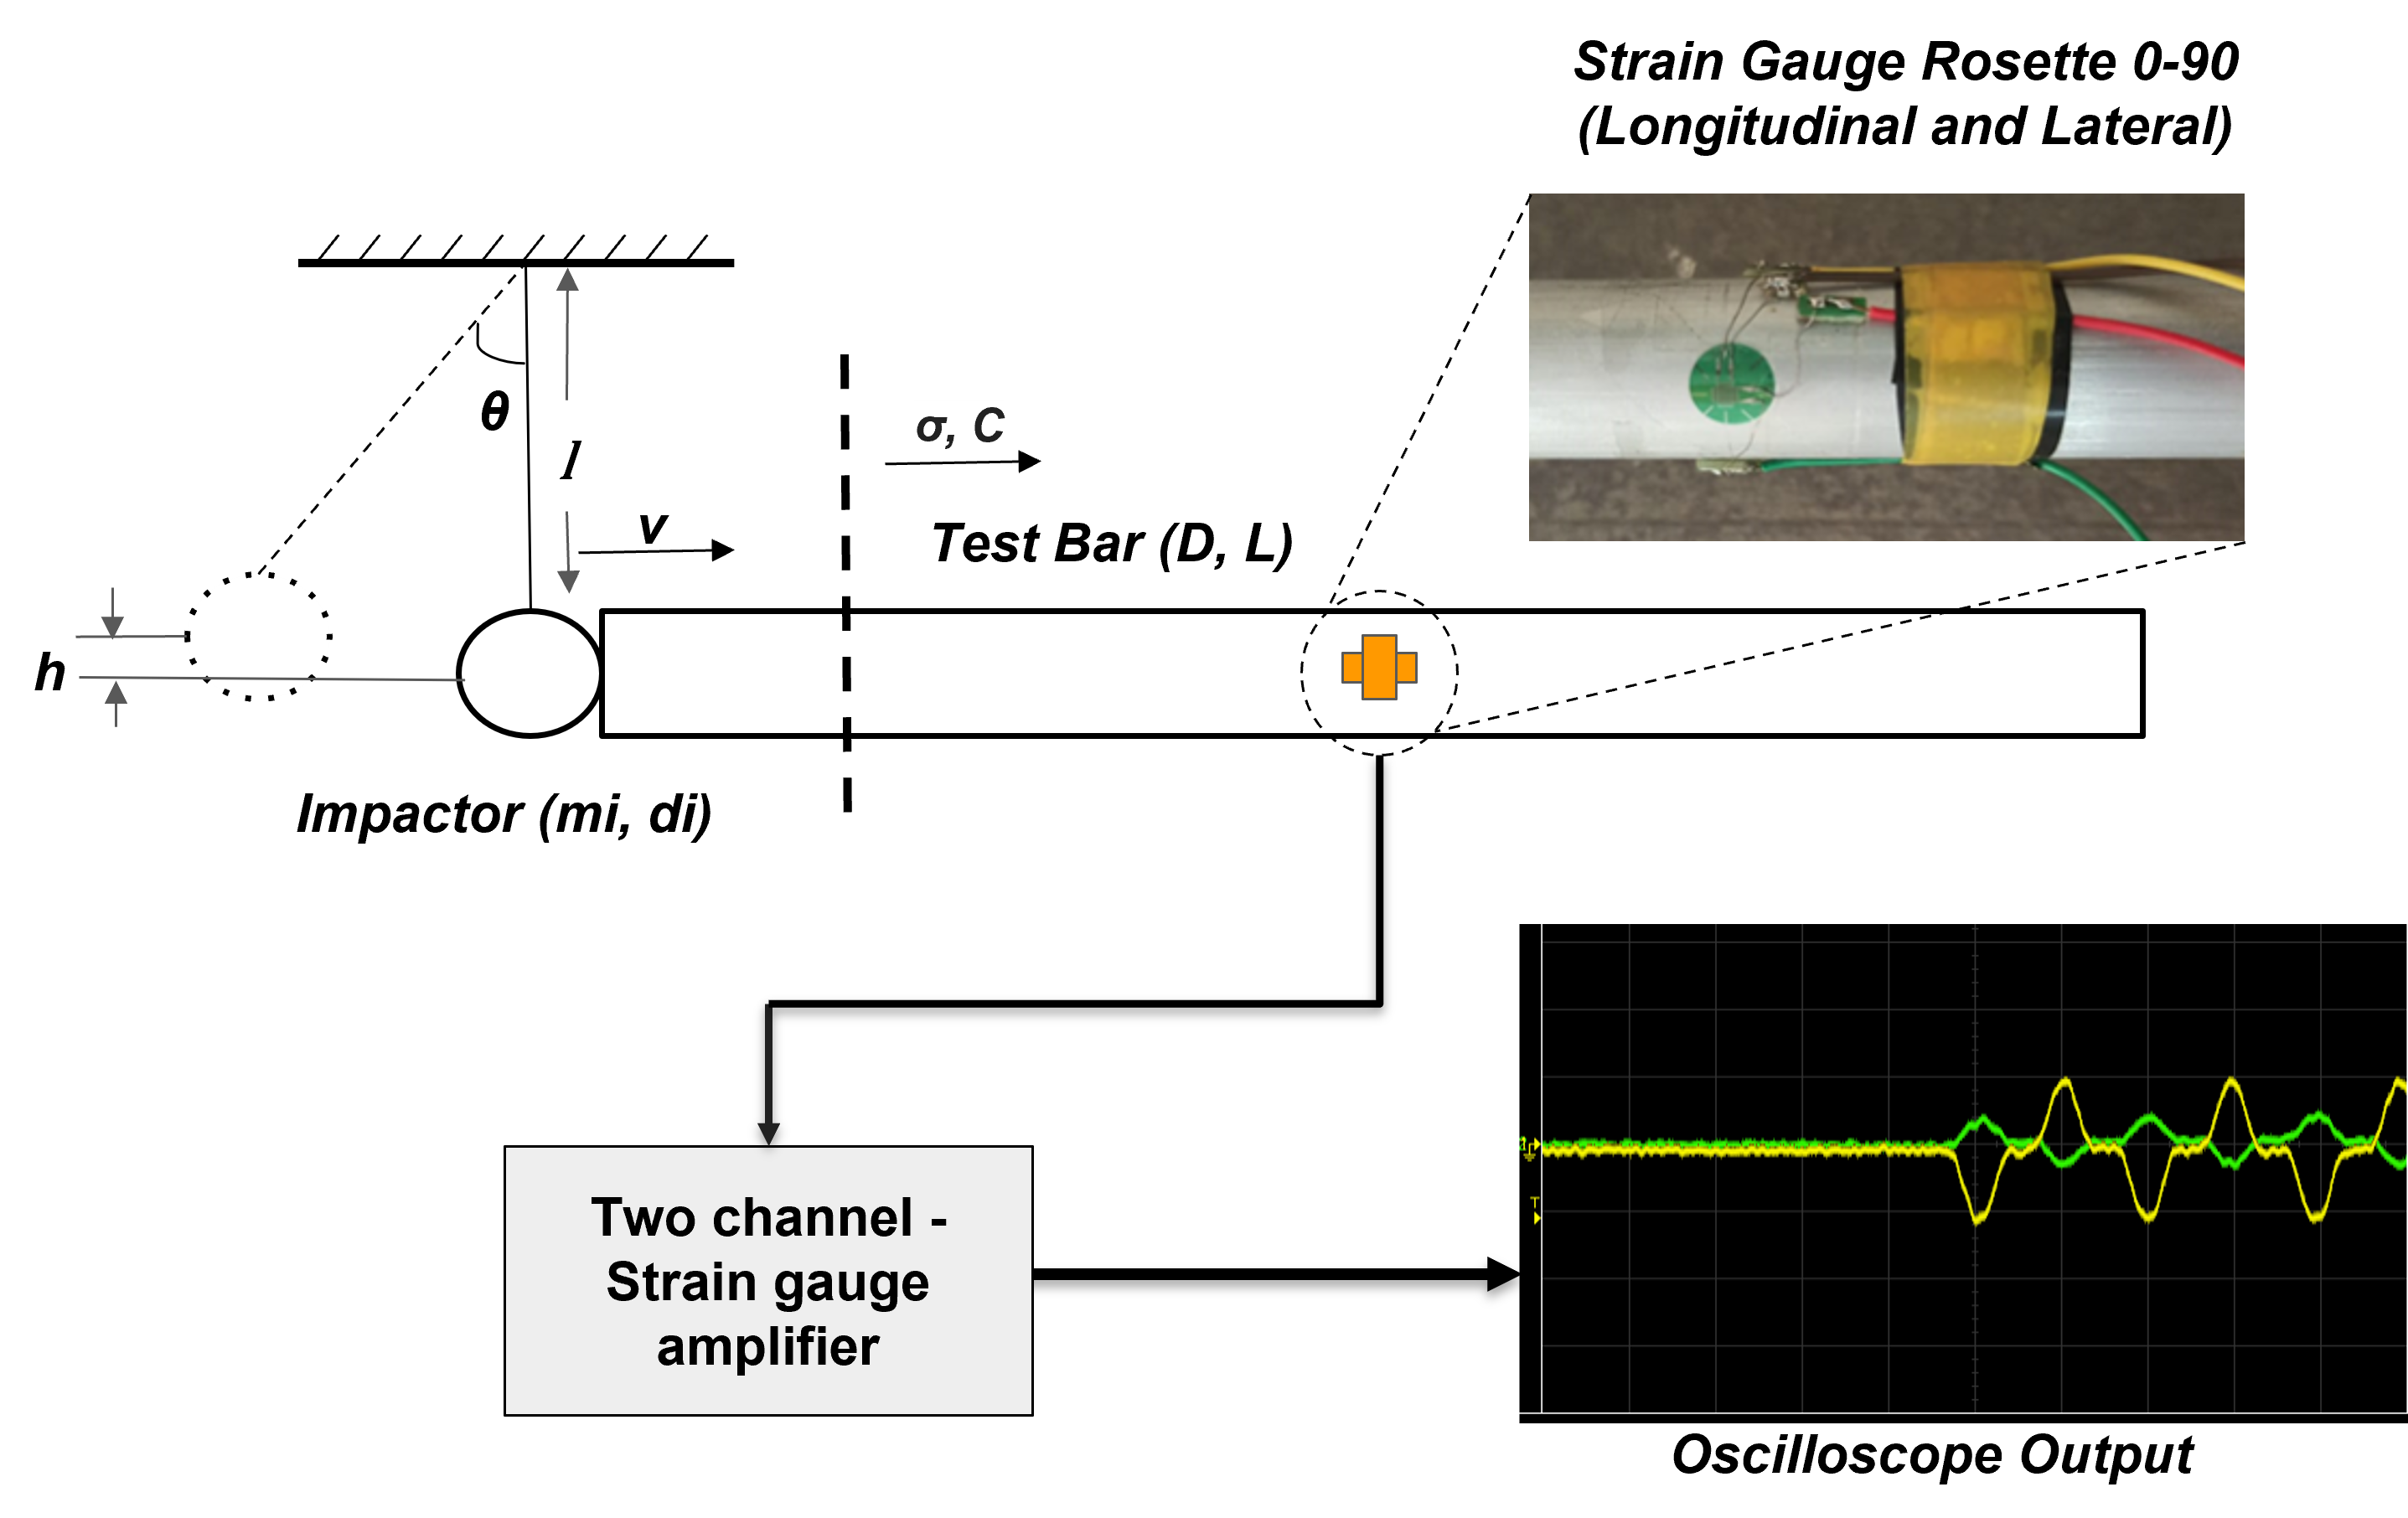
Experimental setup of Ball-Bar impact
The length \( l \) from the point where the nylon thread is tied on top to the center of the ball must be noted. Additionally, the lift angle \( \theta \) at which the ball is released should be recorded. The ball and the rod were arranged coaxially, ensuring that the ball was just in contact with the center of the bar. The ball was pulled in the axial plane to an angle \( \theta \), raising it to a height \( h = l(1 - \cos \theta) \). This caused the ball to strike the bar at a velocity of \( v = \sqrt{2gh} \) when it made contact with the bar upon release.
Results #
BALL ON BAR IMPACT - Wave propagation induced from a single point

Schematic of Ball-Bar impact
BAR ON BAR IMPACT - Wave propagation induced from surface contact

Schematic of Bar-Bar impact
BALL IMPACT ON STEPPED BAR - Wave propagation from a larger to a smaller c/s

Schematic of Ball-Bar impact for Step Down Bar
BALL IMPACT ON STEPPED BAR - Wave propagation from a smaller to a larger c/s
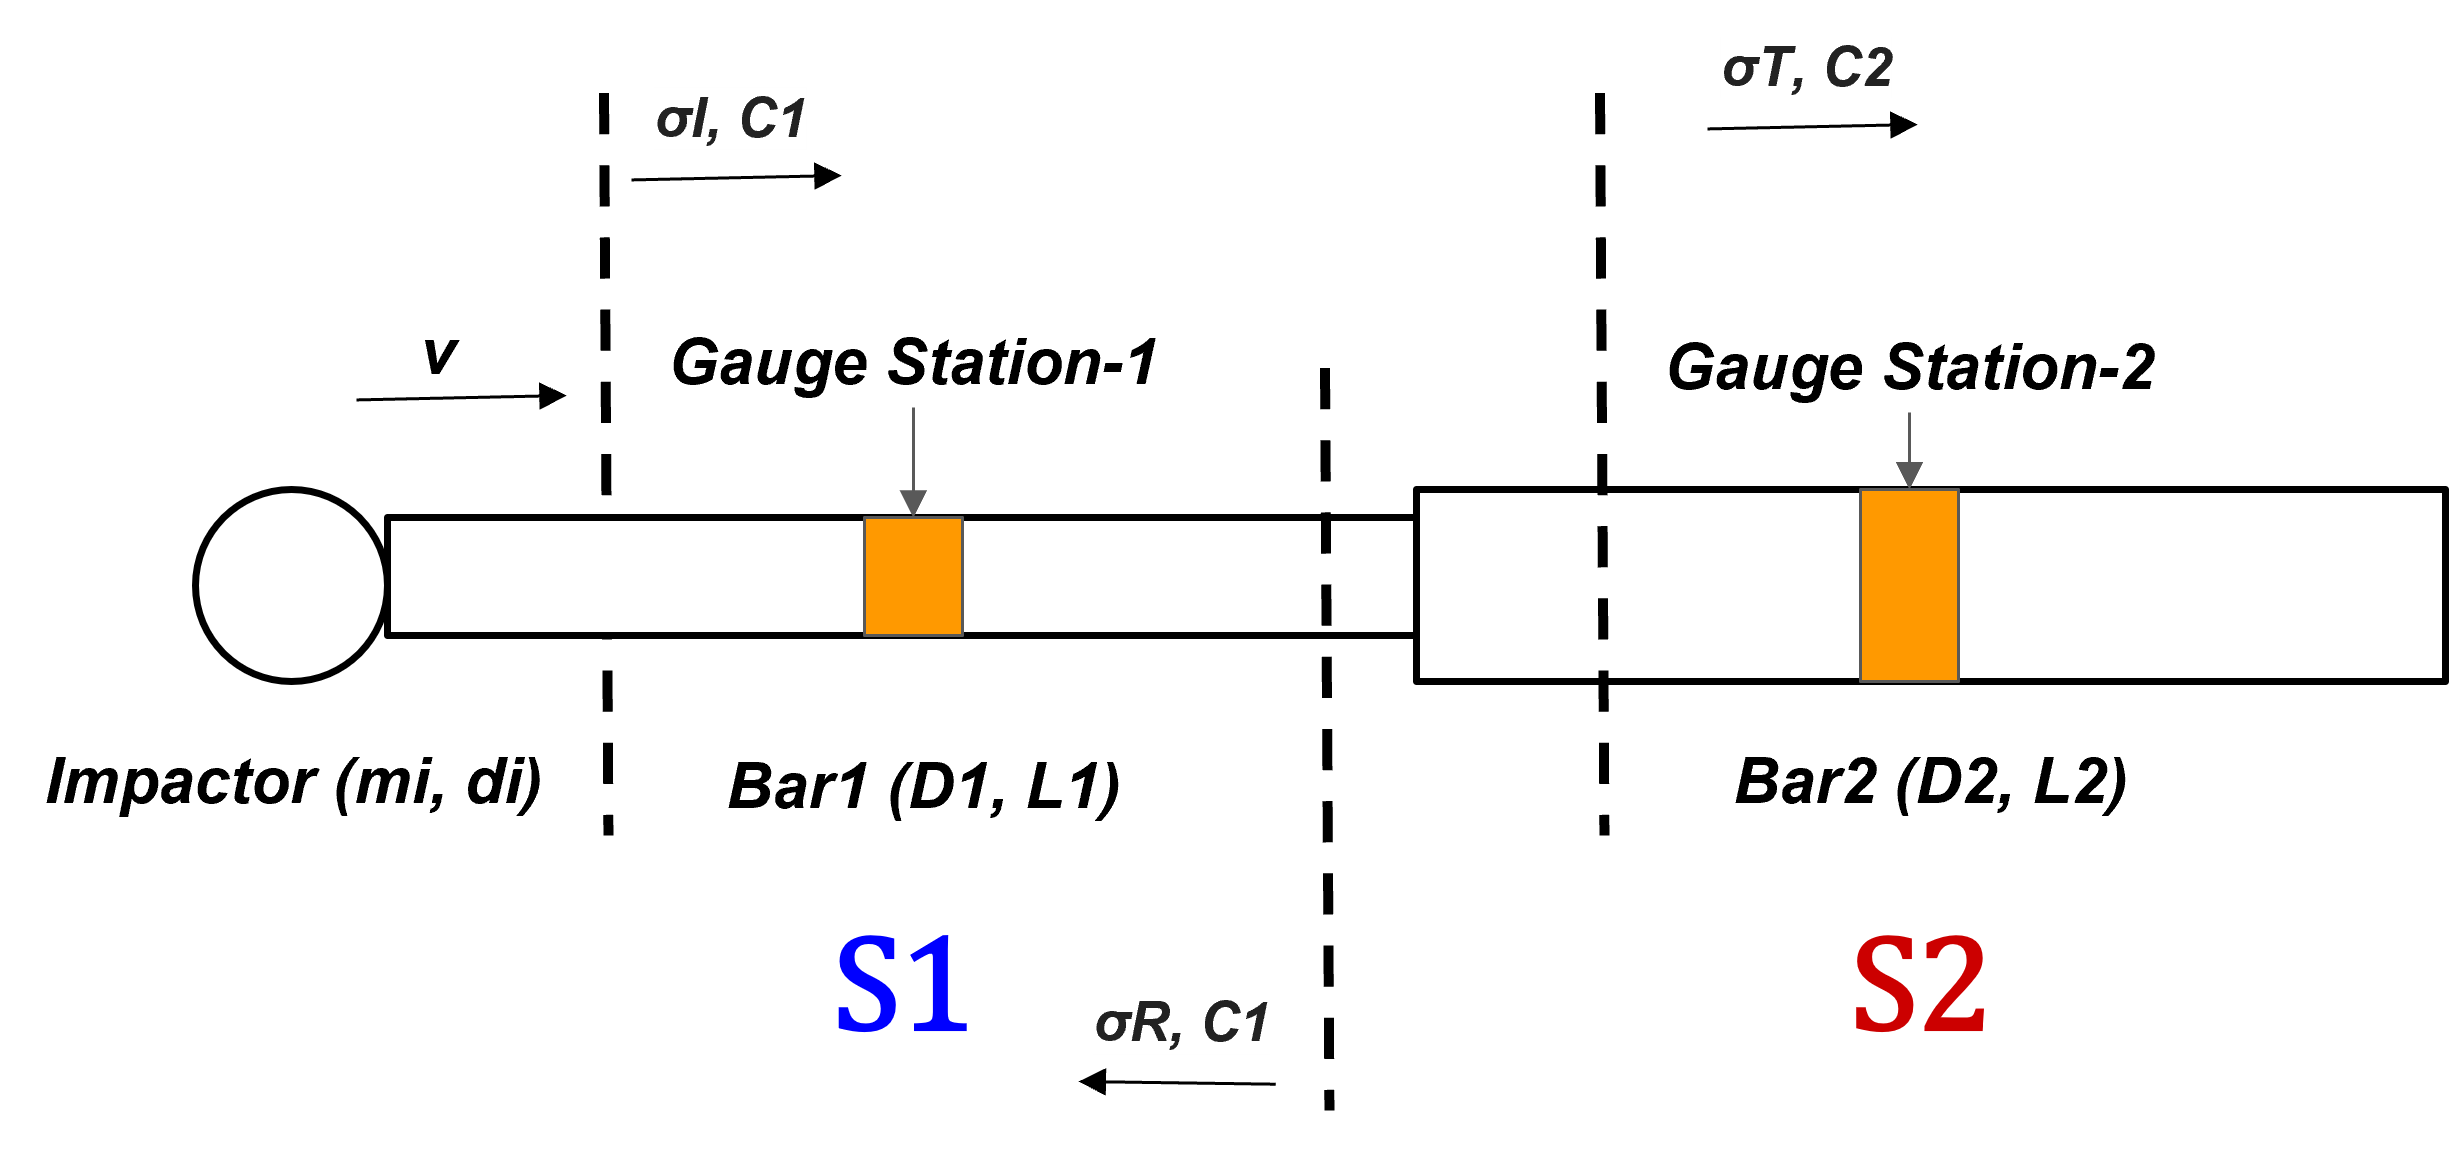
Schematic of Ball-Bar impact for Step Up Bar
BALL IMPACT ON STEPPED BAR - Measurements from a 0-90 Strain Gauge Rosette

Schematic of Ball-Bar Rosette measurements
Material Charaterisation #
The stress wave propagation method is an effective technique for determining the Young's modulus and Poisson's ratio of elastic materials. This method involves an elastic sphere impacting a long rod at a known velocity. The experimental setup, procedures, and numerical calculations required to obtain these material properties are outlined in this documentation.
The elastic sphere, which has known elastic properties, is used to impact the rod. The rod is fitted with strain gauges to measure the resulting strain from the impact. A 0°/90° rosette strain gauge is placed at the center of the rod to capture both longitudinal and lateral strains. The longitudinal and lateral gauges are connected to separate full bridge completion circuits, which are linked to strain gauge amplifiers.
In the procedure, the setup begins by carefully mounting the strain gauges on the rod. The rosette strain gauge is positioned at the rod's center, ensuring that the longitudinal and lateral gauges are correctly connected to their respective circuits. Once the setup is complete, the elastic sphere is impacted on the rod at a predetermined velocity. The velocity of the impact is calculated based on the release angle of the ball from the swing.
As the sphere impacts the rod, strain data is recorded from the strain gauges via the amplifiers. This data is then used to plot the longitudinal and lateral strains on a Strain-Time plot. The maximum strain values, or amplitudes, are identified from this plot. The ratio of lateral to longitudinal strain is then calculated to determine the Poisson's ratio of the material.
Determining Poisson’s Ratio
Poisson's ratio \( \nu \) is calculated using the ratio of lateral strain \( \varepsilon_l \) to longitudinal strain \( \varepsilon_L \):
\[\nu = \frac{\varepsilon_l}{\varepsilon_L} \]Determining Young’s Modulus
Young's modulus (E) can be determined from the stress-strain relationship and the known properties of the materials involved. The stress wave propagation method involves more complex calculations typically derived from the measured strains and the impact dynamics. The wave velocity (C) in the rod is derived from the material density (𝜌) and Young's modulus (E).
\[C = \sqrt{\frac{E}{\rho}} \]The Young's Modulus (E) can be determined from the above equation. To calculate wave speed (C), the characteristic time (T) is noted form the Strain-Time plot. The characteristic time is the time period of the wave for one cycle and is given as: \[T = \frac{2l}{C}\] where \(l\) is the legth of the bar.
The stress wave propagation method provides a reliable way to determine the Young's modulus and Poisson's ratio of elastic materials. Also, the proposed method is a Non-Destructive Testing Experiment for material charaterisation.
References #
- Kolsky, H. (1963). Stress Waves in Solids. United Kingdom: Dover Publications.
- EV Mendonca, PB Shahapur, TY Reddy. (2019) Elementary Experimental Studies on Stress Wave Propagation in Bars
